


Our interactive dashboards let you explore data dynamically, giving you real-time access to key metrics and insights for informed decision-making.

We create custom charts, graphs, and infographics that suit your specific goals, making even the most complex data easy to understand.

Our visualizations are optimized for multiple platforms, ensuring seamless display on desktops, tablets, and mobile devices.

We integrate real-time data feeds into your visualizations, keeping you informed with the latest information at all times.

Our experts turn your raw data into compelling narratives that make your insights clear and actionable for stakeholders.

We integrate advanced analytics, machine learning, and predictive models into visualizations, helping you uncover hidden trends and opportunities.

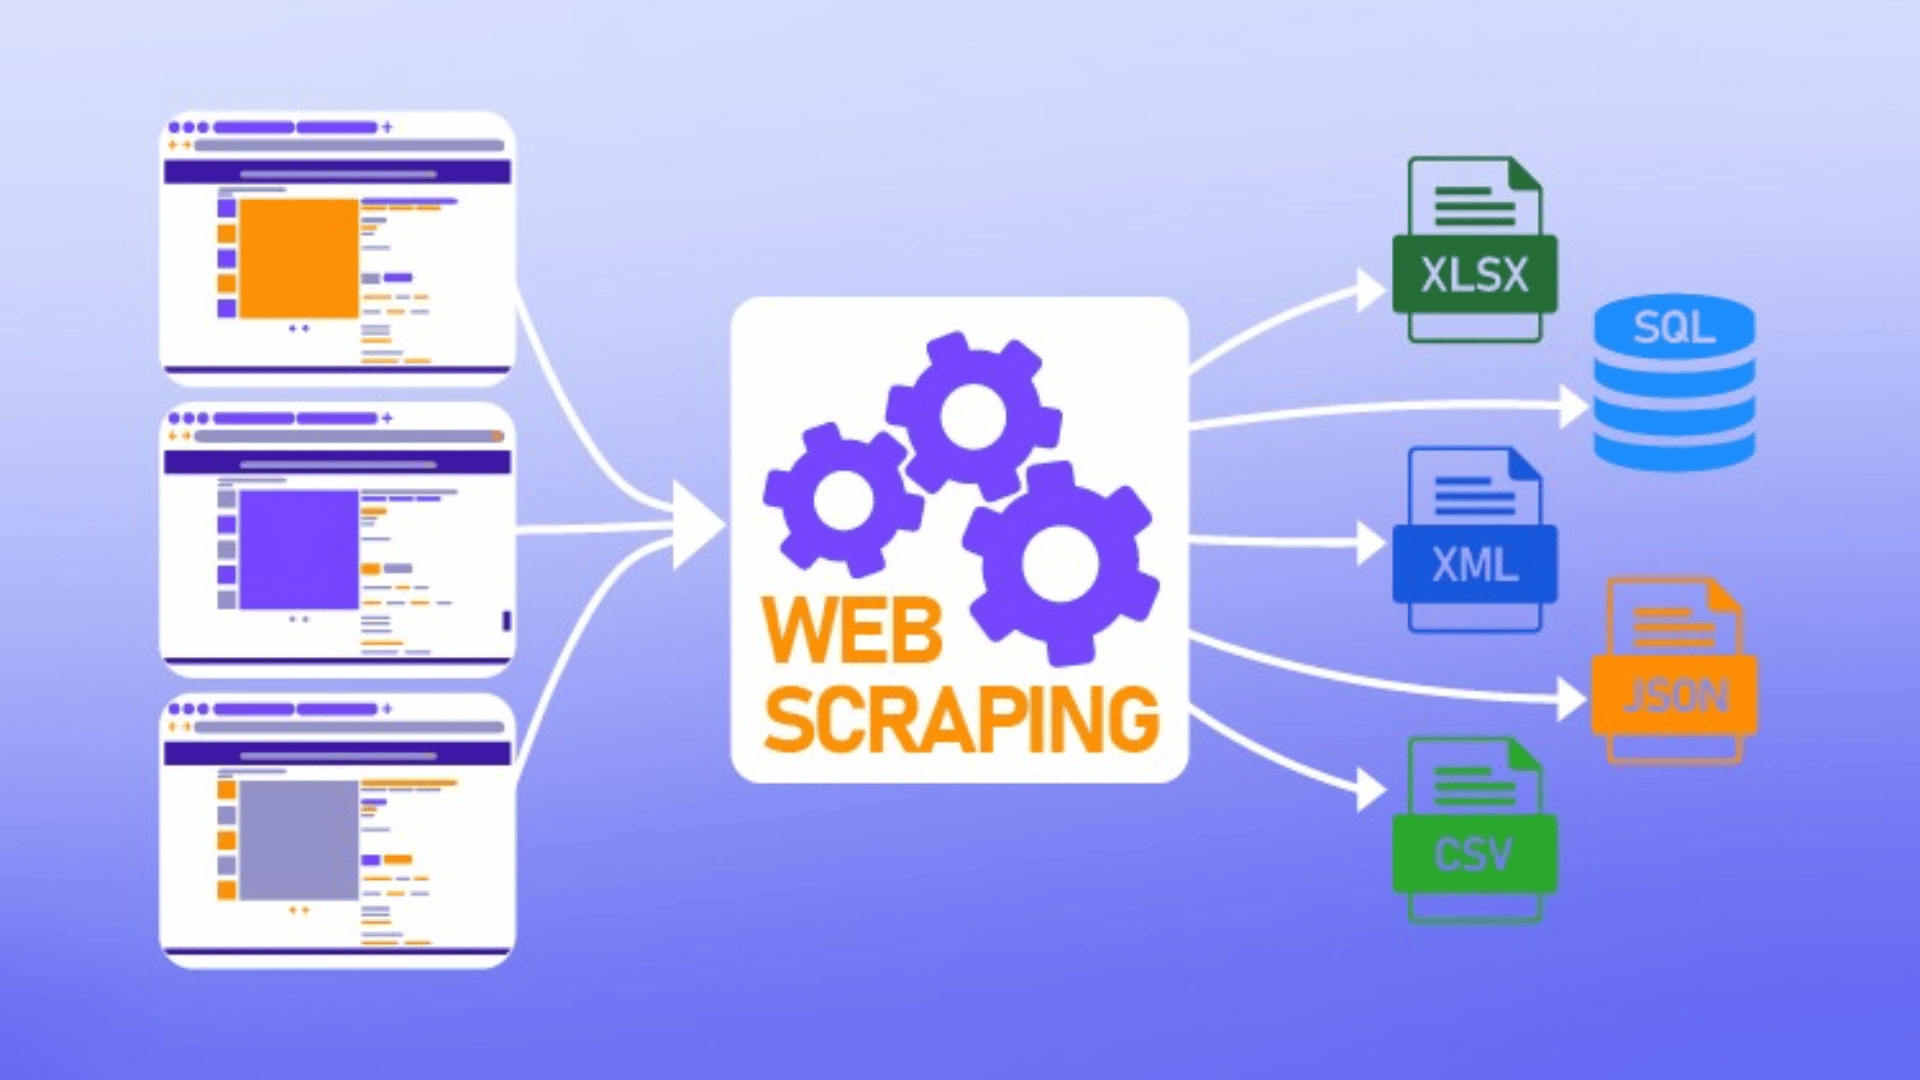
Our visualizations bring together data from multiple sources, providing a holistic view of your organization’s performance.

Allow users to interact with data by filtering, drilling down, and zooming in on specific areas of interest, making exploration easy and intuitive.

Automate the creation of visual reports, ensuring you get regular insights without the manual effort.

We prioritize security, ensuring all data visualizations and dashboards are handled with industry-standard security protocols.
 Faster Decision-Making
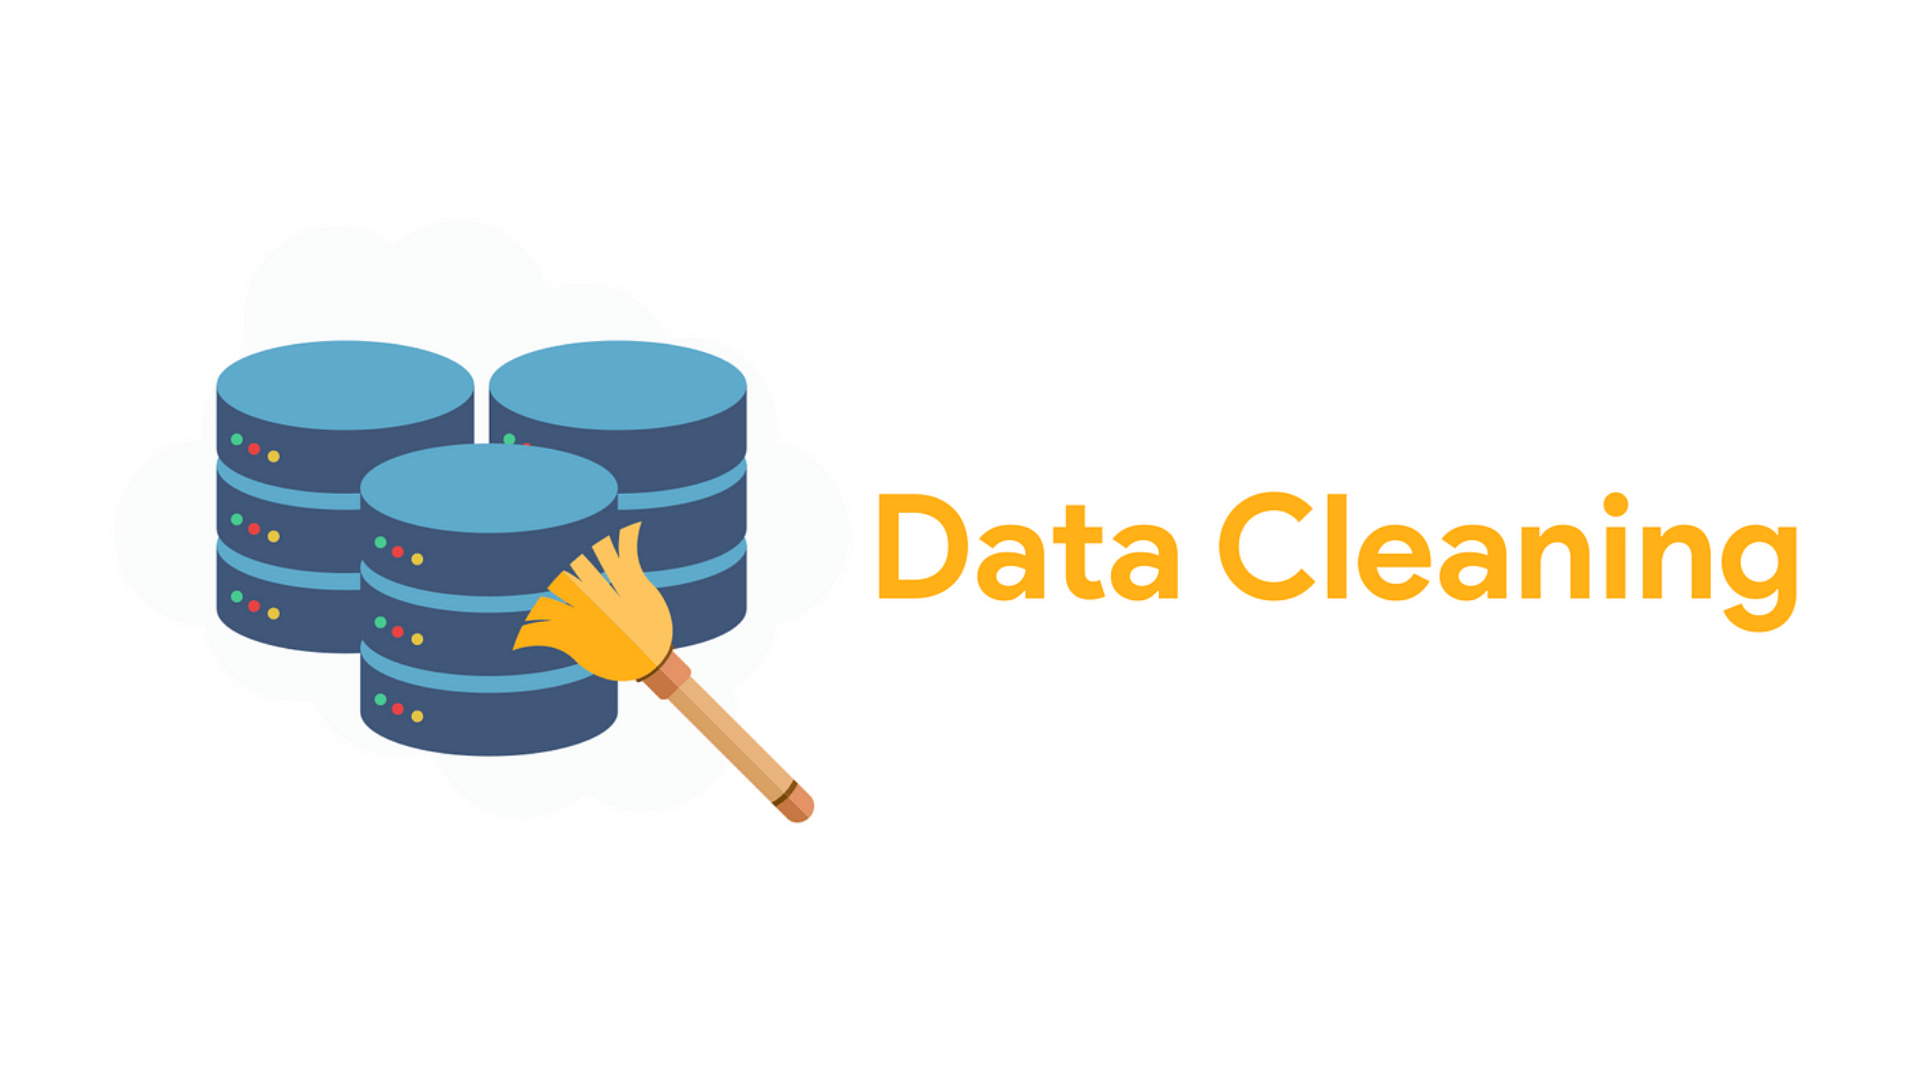
 Improved Data Accuracy
 Enhanced Stakeholder Communication
 Better Understanding of Business Performance
 Increased Engagement with Data

Visualize data for clarity, insight, and smarter decision-making.
💼 Transform Your Business! Identify Growth Opportunities
 Improved Efficiency
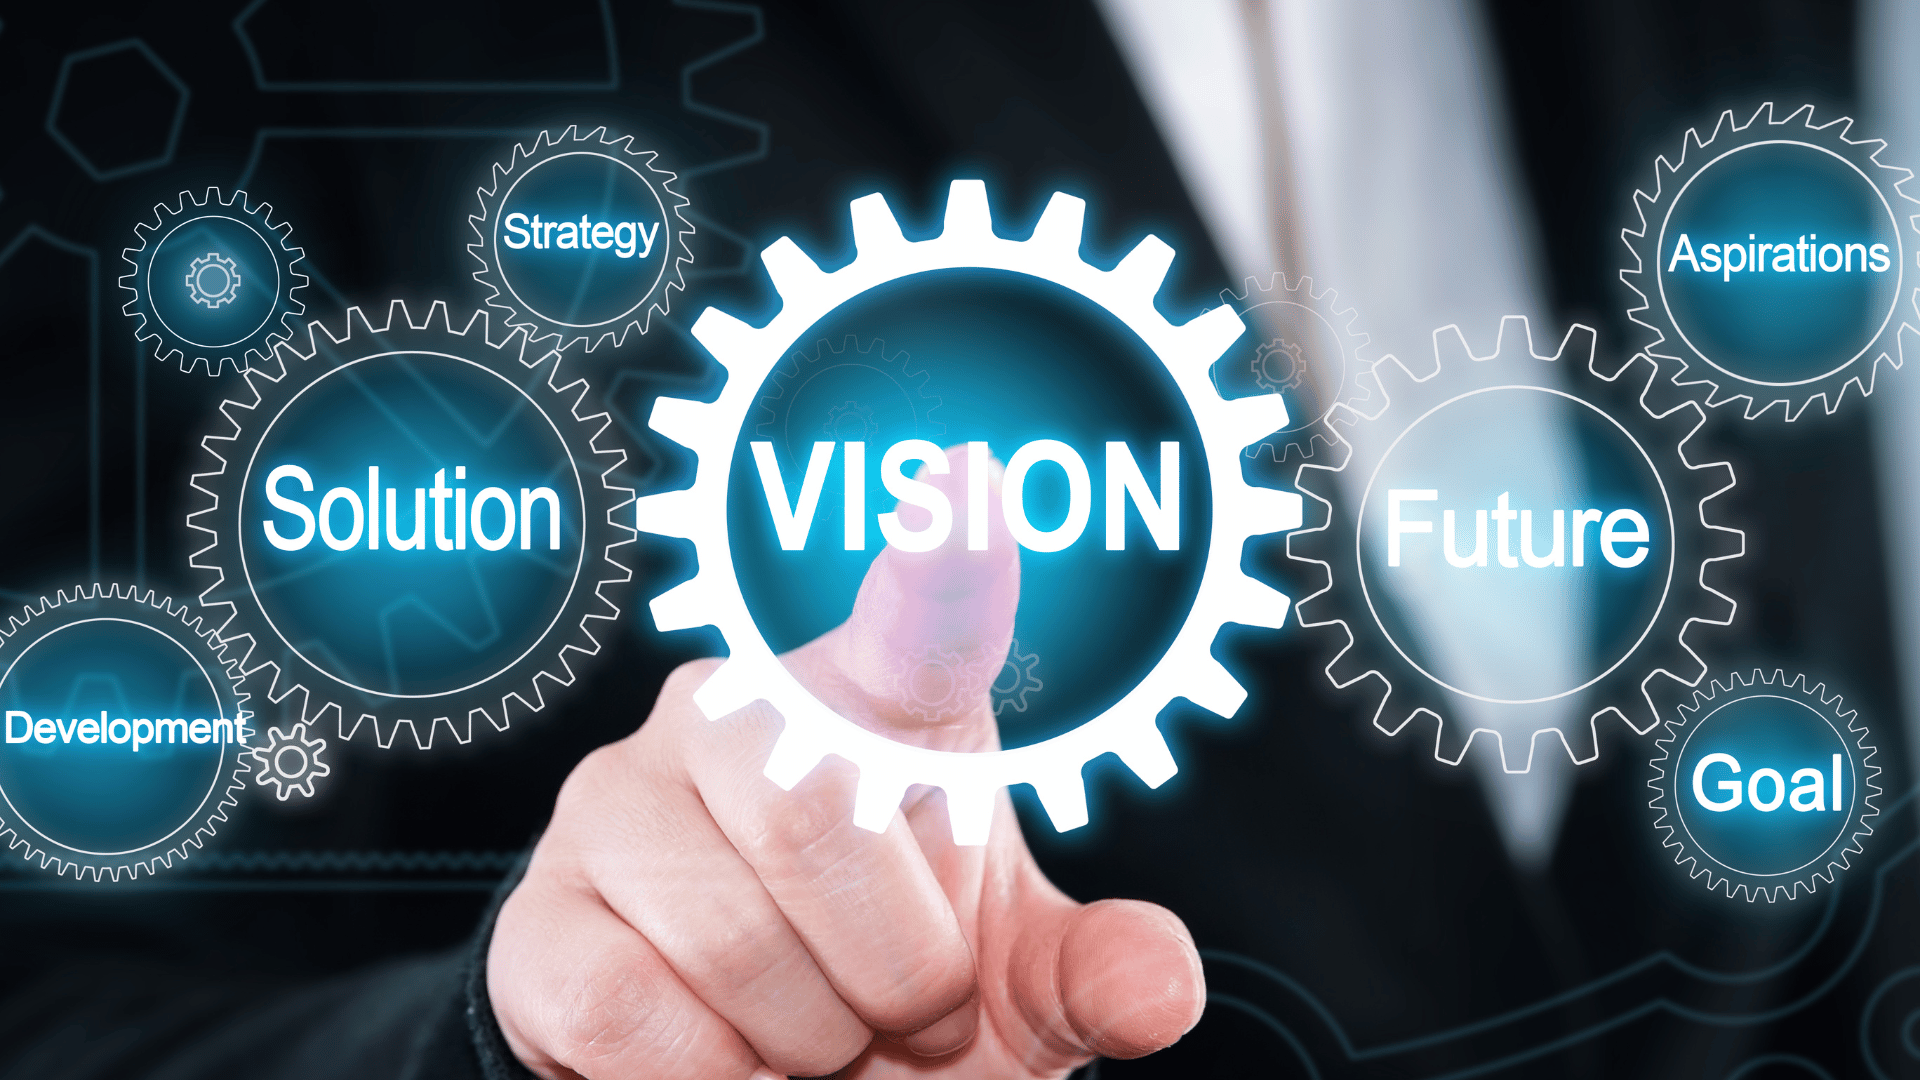
 Stronger Strategic Planning
 Drive Collaboration Across Teams
 Boost Competitive Advantage